UniSplicer
Universal deep learning models for intron splice site prediction across taxa
Paste or upload a sequence, select a model, and get splice site probabilities.
Github: https://github.com/GaoLab-BJFU/UniSplicer
Get Started with Splice Site Prediction
Help Information
1. Intron Site Prediction
This tool predicts splice donor and acceptor sites from a gene sequence.
You can either paste your sequence directly into the text box or upload a FASTA file. The output will highlight predicted splice sites.
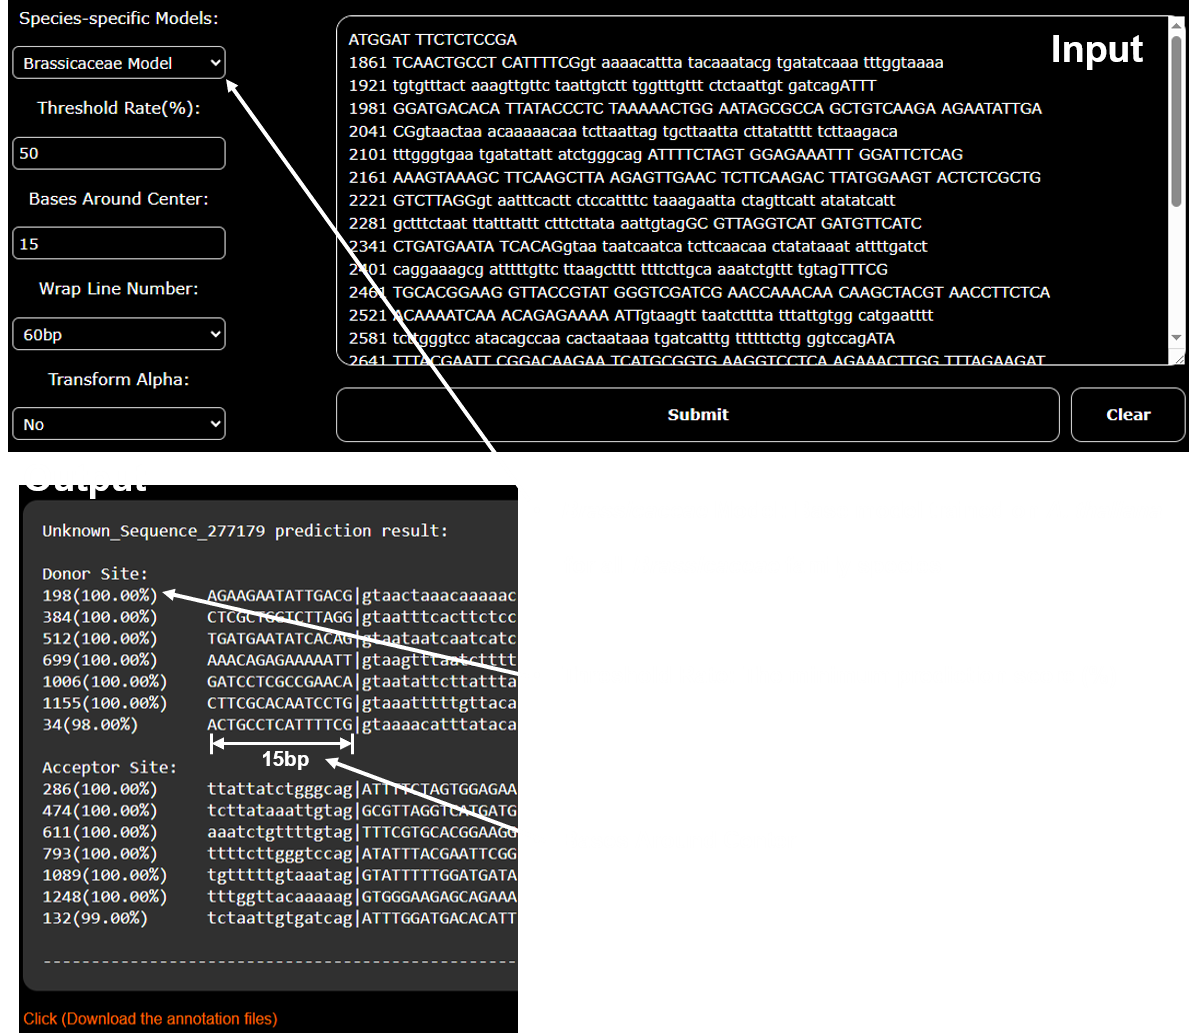
Input
- Free input style: Accepts plain sequences, FASTA format, or FASTA with numbering.
- Upload option: Click Choose file to upload a FASTA file.
- Paste option: Directly paste your sequence into the text box.
Settings
- Species-specific Models: Choose the model trained for your target species.
- Threshold Rate (%): Sets the minimum prediction score for intron sites. Higher threshold = sites with higher confidence.
- Bases Around Center: Defines how many flanking bases to display around each predicted splice site.
- Wrap Line Number: Controls how many bases appear per line in the downloadable sequence file.
-
Transform Alpha: To make the output easier to
read, intron sequences are shown in lowercase while exon
sequences are shown
in uppercase. Specifically, bases after the splice donor site (GT) are displayed in lowercase (intron), and bases after the splice acceptor
site (AG) are displayed in uppercase (exon).
Output
- Predicted donor and acceptor splice sites are marked.
- Results include scores, flanking sequence context, and downloadable files.
2. Mutation Analysis
This tool evaluates how mutations (SNPs and INDELs) affect splice site prediction.
Input
- Original Sequence (left box): Paste or upload the reference gene sequence.
- Mutated Sequence (right box): Paste or upload the sequence containing SNPs or INDELs.
- Free input style: Accepts both plain sequences and FASTA formats.
Settings
- Species-specific Models: Select the model trained for your species of interest.
- Bases Around Center: Sets the flanking sequence length to display around each splice site when comparing predictions.
Output
- Side-by-side comparison of predicted splice sites between the original and mutated sequences.
- Highlights changes in splice site scores caused by mutations.
 Mutation Analysis Example:

Contact Information
Correspondence: Hongbo Gao (gaohongbo@bjfu.edu.cn)
Beijing Forestry University